Integrating Better Stack Logging into a Dockerized Node.js Microservice Stack
Dinesh Wijethunga
When you are running a multi-service Node.js stack in Docker, "just add a logging service" turns out to be a series of small problems stacked on top of each other. This post documents the exact journey of connecting a Ride hailing app that I developed with Laravel and three Node microservices — node-gateway, node-demand, and node-realtime — to Better Stack, including every wall we hit and how we got past it.
The Starting Point
Each Node service had a Winston logger that only logged to the console:
import winston from 'winston';
import { config } from './config.js';

export const logger = winston.createLogger({
  level: config.nodeEnv === 'production' ? 'info' : 'debug',
  format: winston.format.combine(
    winston.format.timestamp(),
    winston.format.errors({ stack: true }),
    config.nodeEnv === 'production'
      ? winston.format.json()
      : winston.format.combine(
          winston.format.colorize(),
          winston.format.simple()
        ),
  ),
  defaultMeta: { service: 'node-gateway' },
  transports: [new winston.transports.Console()],
});
The goal was to ship these logs to Better Stack and also get Prometheus metrics from our exporters into Better Stack's metrics platform.
Step 1 — Creating Sources in Better Stack
The first step is creating a source per service in Better Stack. Go to Logs → Sources → Connect source. The platform dropdown does not have a Node.js option — select JavaScript instead. Node.js is JavaScript as far as Better Stack is concerned and the log parsing works identically.
Create three sources: dineshstack-gateway, dineshstack-demand, and dineshstack-realtime. Each one gives you a unique source token and an ingesting host. Keep them — you need both values per service.
Step 2 — Updating the Winston Logger
Install the Logtail packages in each service directory:
cd services/node-gateway && npm install @logtail/node @logtail/winston
cd services/node-demand && npm install @logtail/node @logtail/winston
cd services/node-realtime && npm install @logtail/node @logtail/winston
Then update each logger to conditionally attach the Logtail transport when credentials are present:
import winston from 'winston';
import { Logtail } from '@logtail/node';
import { LogtailTransport } from '@logtail/winston';
import { config } from './config.js';

const isProduction = config.nodeEnv === 'production';

const productionFormat = winston.format.combine(
  winston.format.timestamp(),
  winston.format.errors({ stack: true }),
  winston.format.json(),
);

const developmentFormat = winston.format.combine(
  winston.format.timestamp(),
  winston.format.errors({ stack: true }),
  winston.format.colorize(),
  winston.format.simple(),
);

const transports: winston.transport[] = [
  new winston.transports.Console(),
];

let logtail: Logtail | null = null;

if (config.logtail.enabled) {
  logtail = new Logtail(config.logtail.sourceToken, {
    endpoint: `https://${config.logtail.ingestingHost}`,
  });
  transports.push(new LogtailTransport(logtail));
}

export const logger = winston.createLogger({
  level: isProduction ? 'info' : 'debug',
  format: isProduction ? productionFormat : developmentFormat,
  defaultMeta: { service: 'node-gateway' }, // change per service
  transports,
});

async function flushAndExit(signal: string) {
  logger.info(`Received ${signal}, flushing logs...`);
  if (logtail) await logtail.flush();
  process.exit(0);
}

process.on('SIGTERM', () => flushAndExit('SIGTERM'));
process.on('SIGINT', () => flushAndExit('SIGINT'));
Add the logtail config block to each service's config.ts:
logtail: {
  sourceToken: process.env.LOGTAIL_SOURCE_TOKEN || '',
  ingestingHost: process.env.LOGTAIL_INGESTING_HOST || '',
  get enabled() {
    return Boolean(this.sourceToken && this.ingestingHost);
  },
},
The enabled getter means the logger works in development with no env vars set — it stays console-only. In production with the vars present, it automatically attaches Better Stack.
Step 3 — The docker-compose.yml Changes
Our docker-compose.yml manages all three Node services with profiles. We added the Logtail env vars to each service's environment block:
node_gateway:
  environment:
    PORT: 3002
    NODE_ENV: production
    LARAVEL_UPSTREAM_URL: "${LARAVEL_UPSTREAM_URL}"
    REALTIME_UPSTREAM_URL: "${REALTIME_UPSTREAM_URL}"
    LARAVEL_INTROSPECT_URL: "${LARAVEL_INTROSPECT_URL}"
    INTERNAL_API_KEY: "${BOOKING_CONFIG_INTERNAL_KEY}"
    LOGTAIL_SOURCE_TOKEN: "${LOGTAIL_GATEWAY_TOKEN}"
    LOGTAIL_INGESTING_HOST: "${LOGTAIL_GATEWAY_HOST}"

node_demand:
  environment:
    PORT: 3001
    NODE_ENV: production
    LARAVEL_INTERNAL_URL: "${LARAVEL_INTERNAL_URL}"
    INTERNAL_API_KEY: "${BOOKING_CONFIG_INTERNAL_KEY}"
    KAFKA_BROKERS: "${KAFKA_BROKERS}"
    LOGTAIL_SOURCE_TOKEN: "${LOGTAIL_DEMAND_TOKEN}"
    LOGTAIL_INGESTING_HOST: "${LOGTAIL_DEMAND_HOST}"

node_realtime:
  environment:
    PORT: 3000
    NODE_ENV: production
    LARAVEL_INTERNAL_URL: "${LARAVEL_INTERNAL_URL}"
    INTERNAL_API_KEY: "${BOOKING_CONFIG_INTERNAL_KEY}"
    KAFKA_BROKERS: "${KAFKA_BROKERS}"
    LOGTAIL_SOURCE_TOKEN: "${LOGTAIL_REALTIME_TOKEN}"
    LOGTAIL_INGESTING_HOST: "${LOGTAIL_REALTIME_HOST}"
Step 4 — The .env File
Add these lines to your root .env file. Each service gets its own token but the variable names must match exactly what docker-compose.yml references:
# Better Stack (Logtail)
LOGTAIL_GATEWAY_TOKEN=your_gateway_source_token
LOGTAIL_GATEWAY_HOST=s2408981.eu-fsn-3.betterstackdata.com

LOGTAIL_DEMAND_TOKEN=your_demand_source_token
LOGTAIL_DEMAND_HOST=s2408983.eu-fsn-3.betterstackdata.com

LOGTAIL_REALTIME_TOKEN=your_realtime_source_token
LOGTAIL_REALTIME_HOST=s2408990.eu-fsn-3.betterstackdata.com
Problem 1 — Docker Compose Not Reading .env
After updating the .env file, running docker compose config showed empty values for all LOGTAIL variables. The problem was that our stack uses Docker Compose profiles, and running docker compose config without specifying profiles returns services: {} — an empty config. Docker Compose only resolves variables for services that are active under the current profiles.
The fix is always to specify all profiles when running config or up commands:
docker compose --profile services --profile kafka --profile gateway config | grep LOGTAILProblem 2 — Build Failed: Missing npm Packages
When rebuilding the Docker images, the build failed with:
src/logger.ts(2,25): error TS2307: Cannot find module '@logtail/node'
src/logger.ts(3,34): error TS2307: Cannot find module '@logtail/winston'
The Docker build runs npm ci inside the container using the package.json from the build context. Installing packages locally with npm install on the host machine updates package.json and package-lock.json, but we had not done this before building. The fix was to run npm install inside each service directory on the host first, then rebuild:
cd services/node-gateway && npm install @logtail/node @logtail/winston
cd services/node-demand && npm install @logtail/node @logtail/winston
cd services/node-realtime && npm install @logtail/node @logtail/winston
Then rebuild and restart:
docker compose --profile services --profile kafka --profile gateway \
  build node_gateway node_demand node_realtime

docker compose --profile kafka --profile gateway up -d --no-deps node_gateway
docker compose --profile kafka up -d --no-deps node_demand
docker compose --profile services up -d --no-deps node_realtime
Problem 3 — Prometheus Metrics Behind Cloudflare
Better Stack's Prometheus scrape source requires you to whitelist their scraper IPs in your firewall. The IPs they provide are their own servers, but our domain api1.dineshstack.ae is proxied through Cloudflare. This means Better Stack's scrapers hit Cloudflare first, and Cloudflare's IPs are what nginx sees — not Better Stack's IPs.
The nginx location blocks with Better Stack's IPs allowed everyone through except Better Stack. The fix is to whitelist the full Cloudflare IP ranges instead:
location /metrics/node {
    allow 173.245.48.0/20;
    allow 103.21.244.0/22;
    allow 103.22.200.0/22;
    allow 103.31.4.0/22;
    allow 141.101.64.0/18;
    allow 108.162.192.0/18;
    allow 190.93.240.0/20;
    allow 188.114.96.0/20;
    allow 197.234.240.0/22;
    allow 198.41.128.0/17;
    allow 162.158.0.0/15;
    allow 104.16.0.0/13;
    allow 104.24.0.0/14;
    allow 172.64.0.0/13;
    allow 131.0.72.0/22;
    deny  all;

    proxy_pass http://127.0.0.1:9100/metrics;
    proxy_http_version 1.1;
    proxy_set_header Host $host;
}
Repeat the same allow/deny block for /metrics/redis, /metrics/mysql, and /metrics/kafka pointing to ports 9121, 9104, and 9308 respectively. After reloading nginx, Better Stack's scrapers started receiving 200 responses through Cloudflare.
Verifying Everything Works
Check that env vars are loaded inside containers:
docker exec dineshstack-services-node_gateway-1 env | grep LOGTAIL
docker exec dineshstack-services-node_demand-1 env | grep LOGTAIL
docker exec dineshstack-services-node_realtime-1 env | grep LOGTAIL
Check that Winston logs show the service tag (not raw Fastify format):
docker compose logs node_gateway | tail -5You want to see lines like:
node_gateway-1 | info: node-gateway listening on port 3002
  {"service":"node-gateway","timestamp":"2026-05-01T10:17:55.348Z"}
Not the raw Fastify format:
node_gateway-1 | {"level":30,"time":1777630679747,"pid":1,...}Check that Prometheus exporters are reachable locally:
curl -s http://127.0.0.1:9101/metrics | head -3
curl -s http://127.0.0.1:9122/metrics | head -3
curl -s http://127.0.0.1:9103/metrics | head -3
curl -s http://127.0.0.1:9307/metrics | head -3
Each should return Prometheus metric lines starting with #.
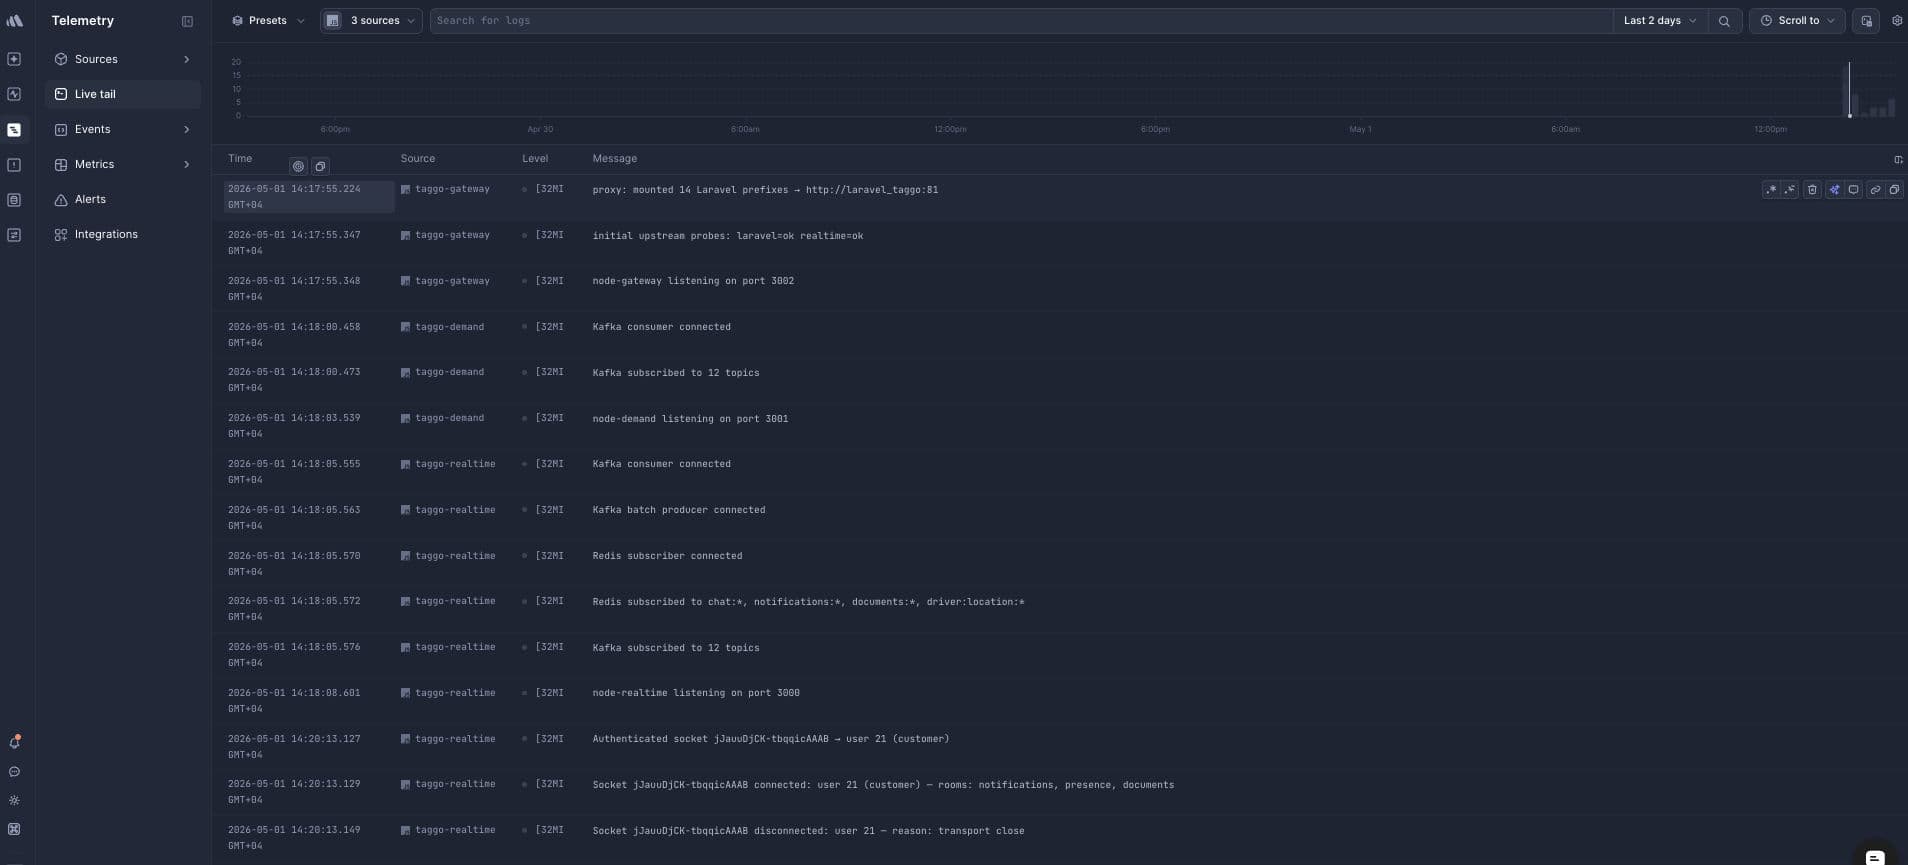
The Result
After working through all four problems, the full observability stack for Ride hailing app is live in Better Stack. All three Node services ship structured Winston logs tagged by service name. Node exporter, Redis exporter, MySQL exporter, and Kafka exporter metrics are scraped every 15 seconds. Socket.io connection events, Kafka consumer state, dispatch loop activity, and API gateway traffic are all visible in real time from a single dashboard.
The next post covers setting up alerts and building dashboards on top of this data.
Reviews & Ratings
Sign in to leave a review.